Google Analytics is an awesome platform. It’s the most advanced, flexible and the smartest website analytics software that comes for free. But it will easily take you days (if not months to figure out!)
While digging deep into the data is important, you may want to leave it to pros while enjoying the simplified regular reports using the following tools:
Whatagraph
Whatagraph is a most indepth, yet easy-to-understand visualization of Google Analytics I have ever seen. Below are some screenshots of visualizations for you to enjoy!
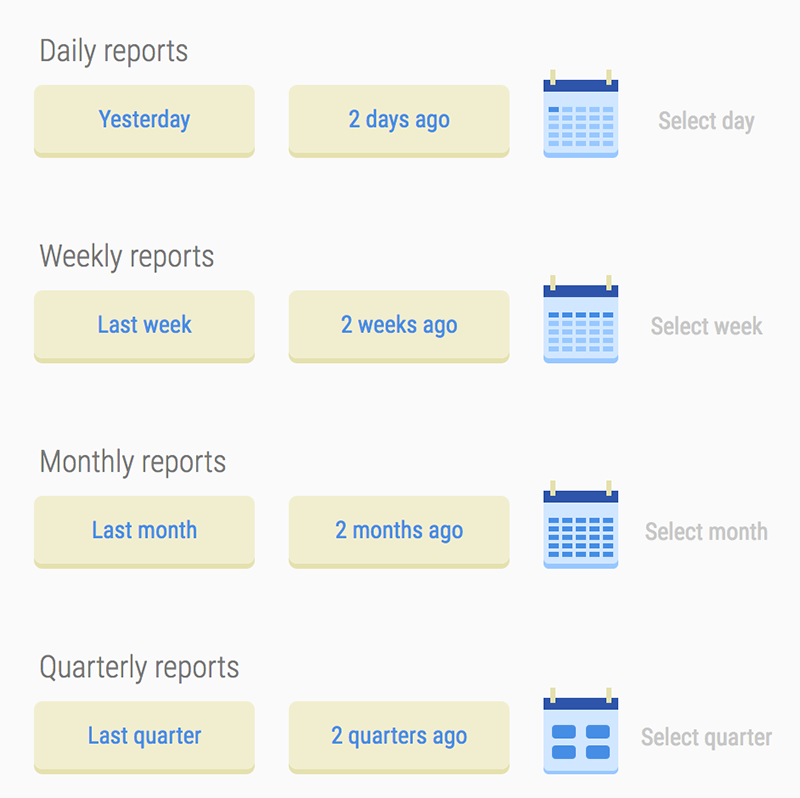
To set it up, you’ll need to approve its access to your Google Analytics account and then choose the sites you want to create regular reports for. Then choose which reports you want to receive daily and weekly:
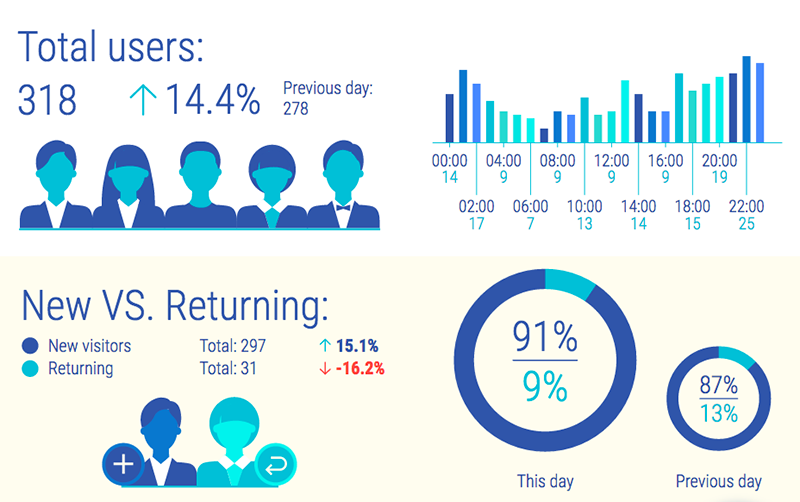
Site Reports
General user stats: Total users as week as new vs returning users
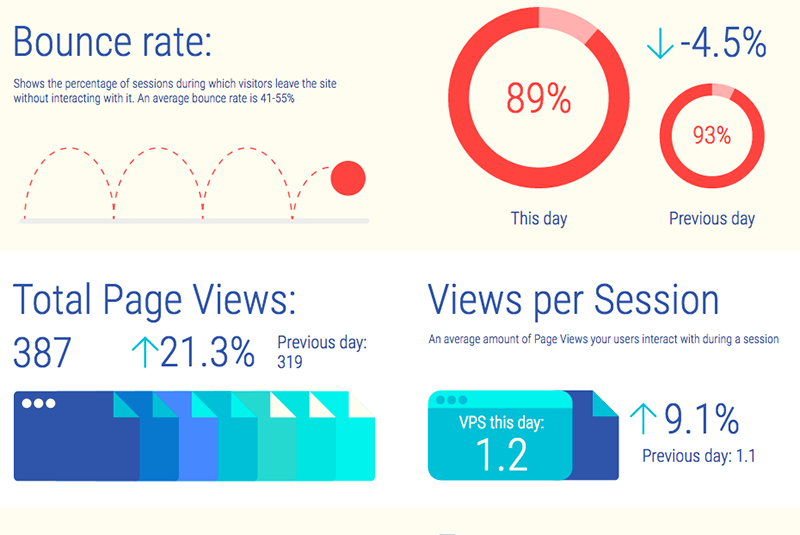
General engagement stats: Bounce rate as well as views per session
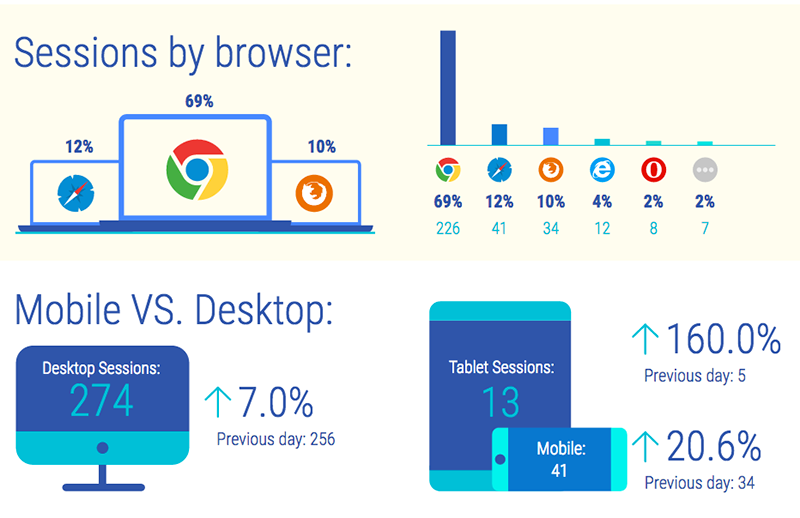
Device stats: Browsers, mobile vs desktop
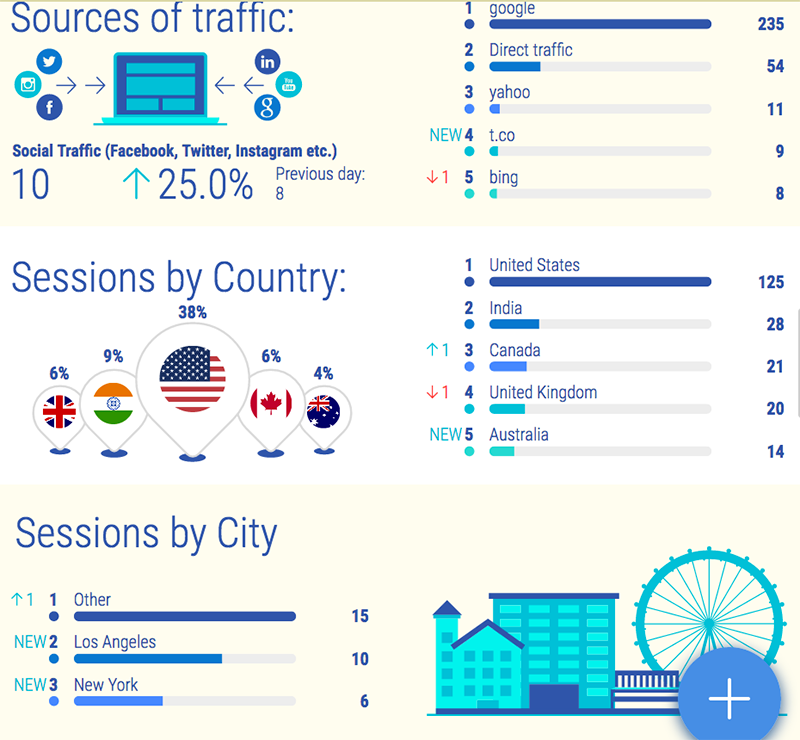
Sources of traffic: Channels, countries, cities
Page-Level Reports
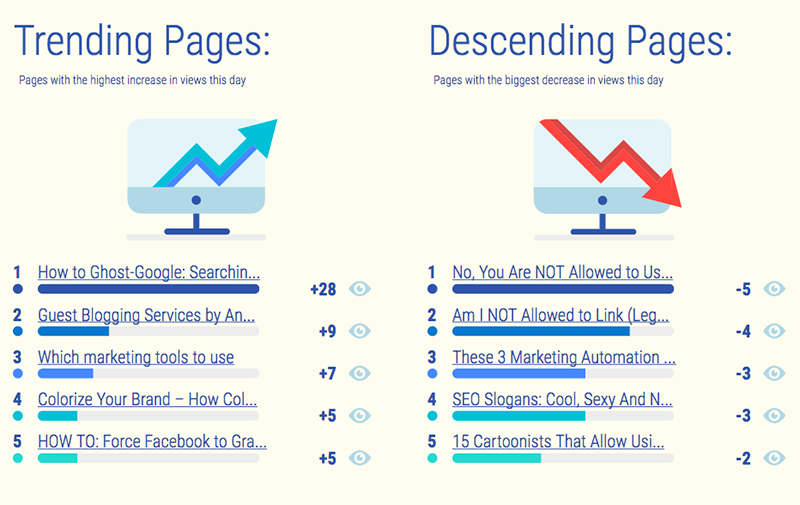
Trending and descending pages (Pages with highest increase in views this day vs pages with the biggest decrease in views this day):
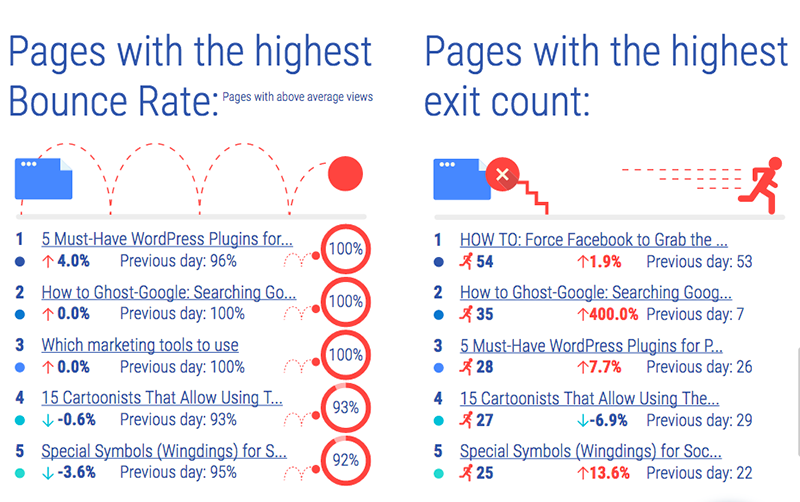
Pages with the highest bounce rate and the highest exit count (Check these pages for bad user experience!)
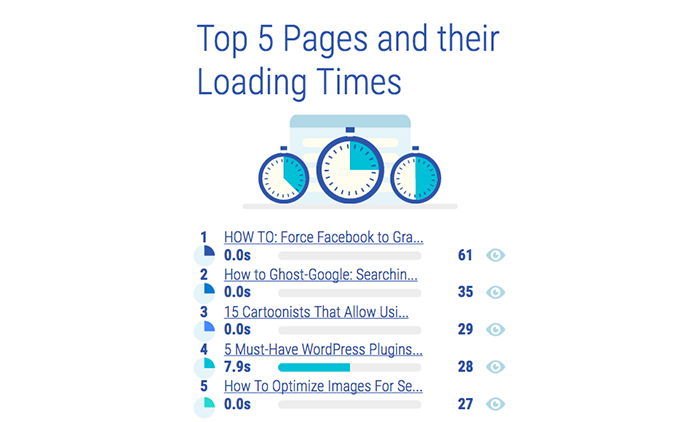
Top 5 pages and their loading time
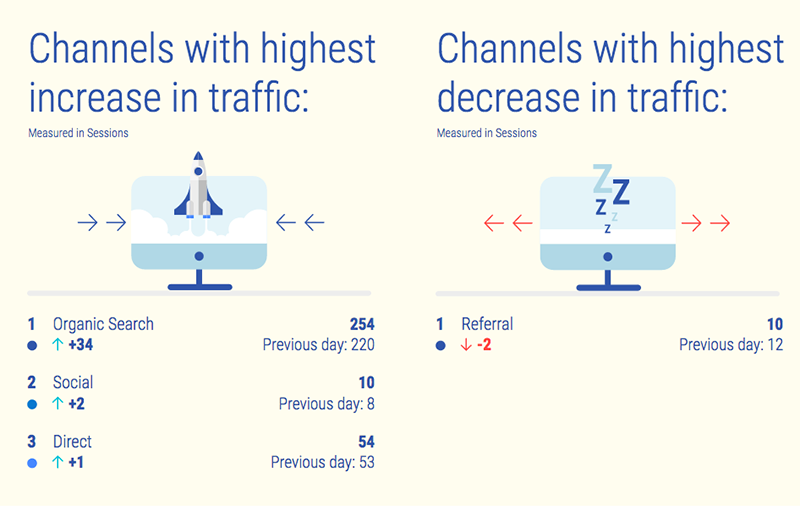
Channel Reports
Channels with highest increase in traffic and channels with highest decrease in traffic
Also included in the reports you’ll see:
- Goal completion stats
- In-site search stats
What a neat tool!
Sumome
Sumome has other cool features, so I haven’t installed it for its Google Analytics integration, but having it there, why not enable and play?
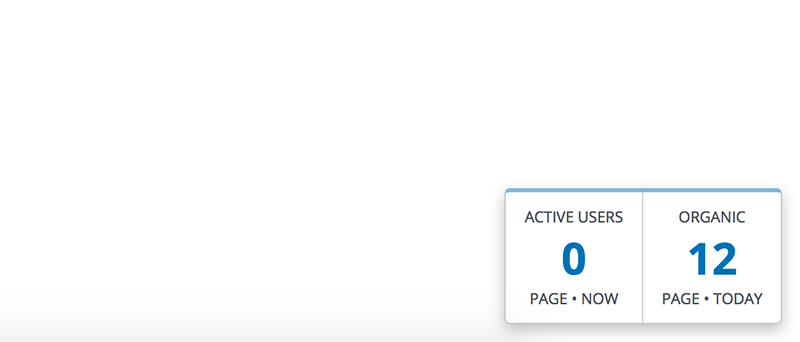
Sumome will show you current page stats from Google Analytics as you browse your own site:
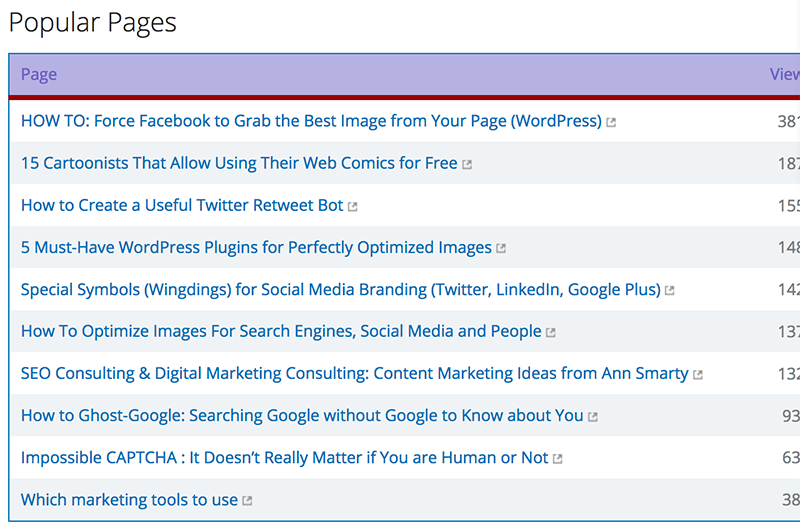
On top of that, there’s a handy dashboard inside showing the most popular pages from your site (in terms of incoming traffic):
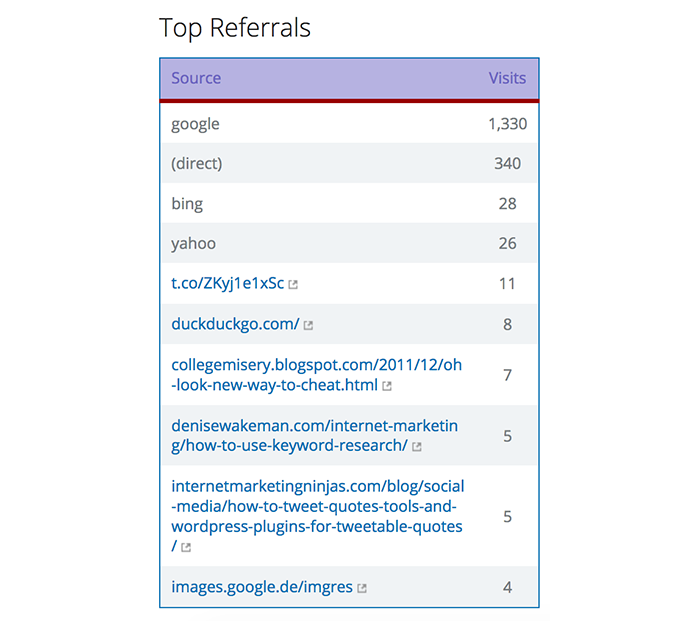
And top referrals:
3. DataDeck
DataDeck is a multi-task analytics dashboard you can integrate a lot of sources into including Google Analytics. When setting it up, select your sources, and then select which data you want to see on your dashboard.
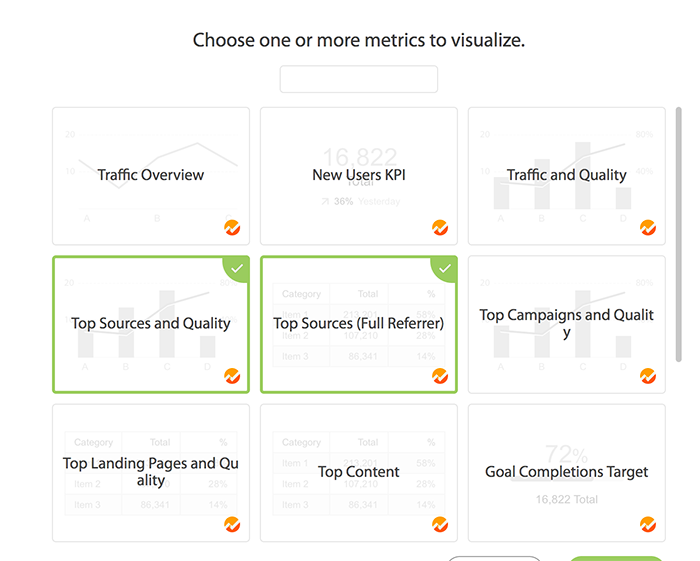
Here’s a sample dashboard based on my settings above:
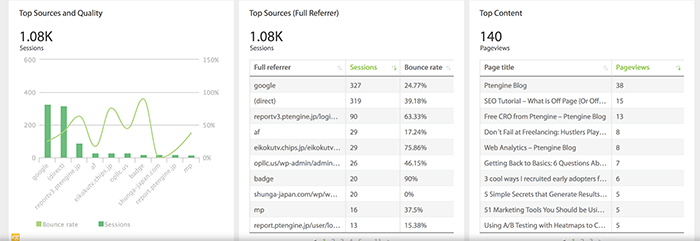
Happy playing!
The post 3 Helpful Apps to Visualize and Simplify Google Analytics Data appeared first on Internet Marketing Ninjas Blog.
